From data to dashboards, our customer analytics tool enables a brilliant analytical experience that your entire team can benefit from. It allows the creation of custom reports and metrics that uses all your data from the Ascent360 platform to determine what is working and what is not. This integrated business intelligence tool enables you to see your data from every angle such as custom reports and metrics. Smartly, you can work with your data to discover everything you need to know.
Robust Customer Profiles
Don't you want to know who is buying, who's not, and who has dropped off? It's super easy to do in the Customer Analytics Tool. You're able to easily expand upon what you know about your customers through appending third party data to create robust customer profiles. With information such as household income, age of children in the households, and interest categories, you can append what you need to know about your customers in order to segment, personalize, and enhance your marketing campaigns.
RETAIL/BRAND
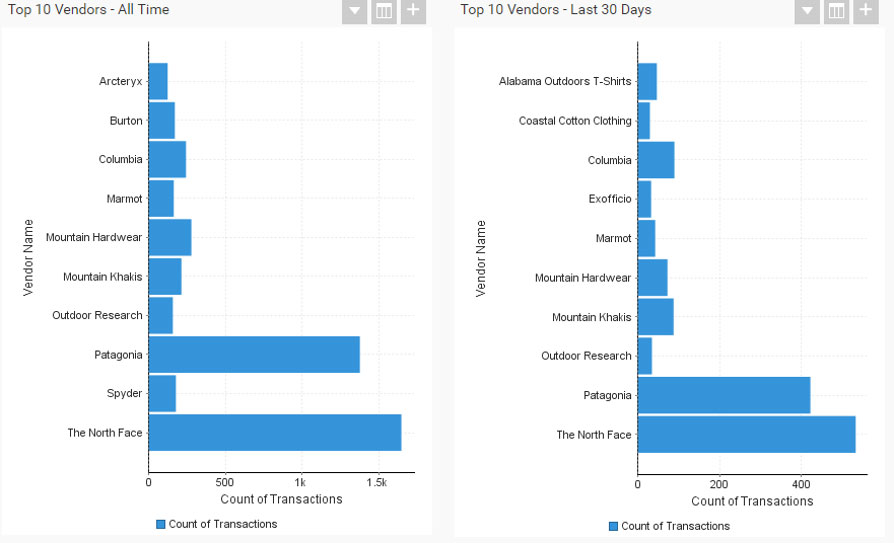
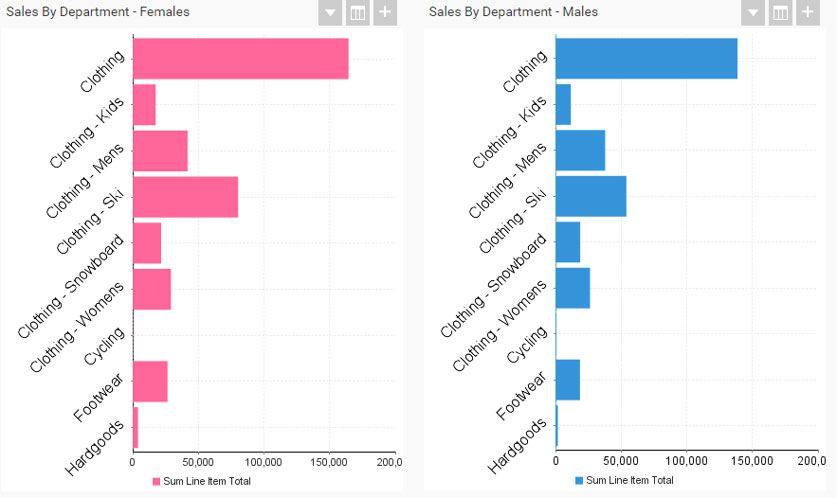
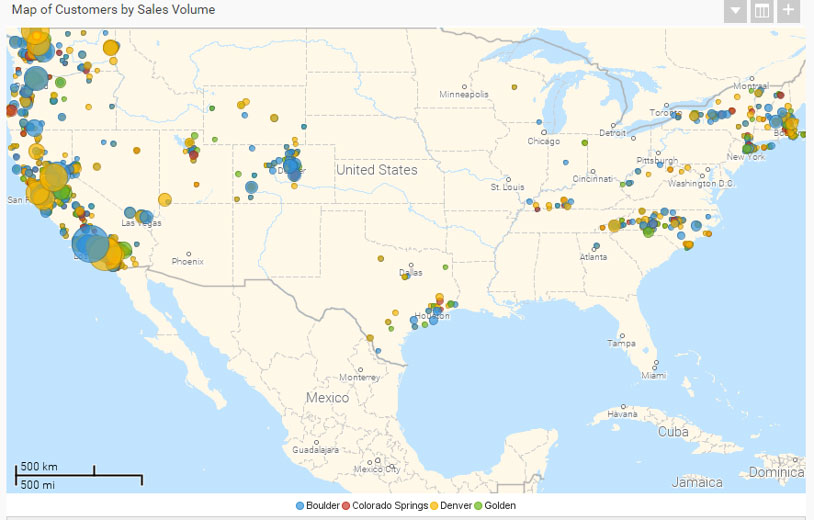
If you're a retailer or brand, there are multiple pieces of your data you are able to analyze. Just to name a few: Loyalty dashboards, Number of new sign-ups, Count of transactions from loyalty members, Sign-ups by month, Loyalty v. Non-loyalty (transactions, items sold, and amount spent), Number of customers with multiple transactions, Customers with transactions in the last three months, Average Order Value and Amount Spent, Number of customers by geographical locations, and more!
CLIENT EXAMPLE:
Running event company, Ragnar Relay created a dashboard to real-time track:
- Individual and team retention to see how many participants returned year to year over an individual race and across the race series
- By race, how many runners or teams were retained from the previous year, from years prior and who are new to the series
EXAMPLE DASHBOARDS
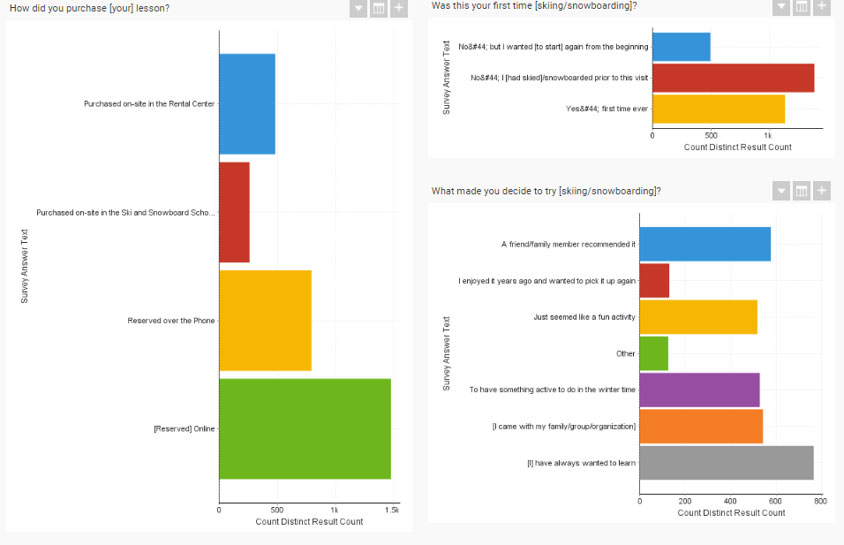
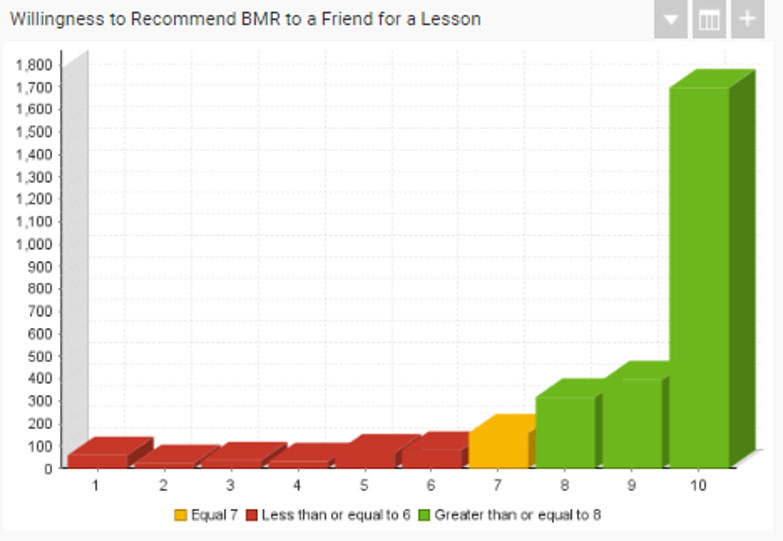
SKI/EVENT
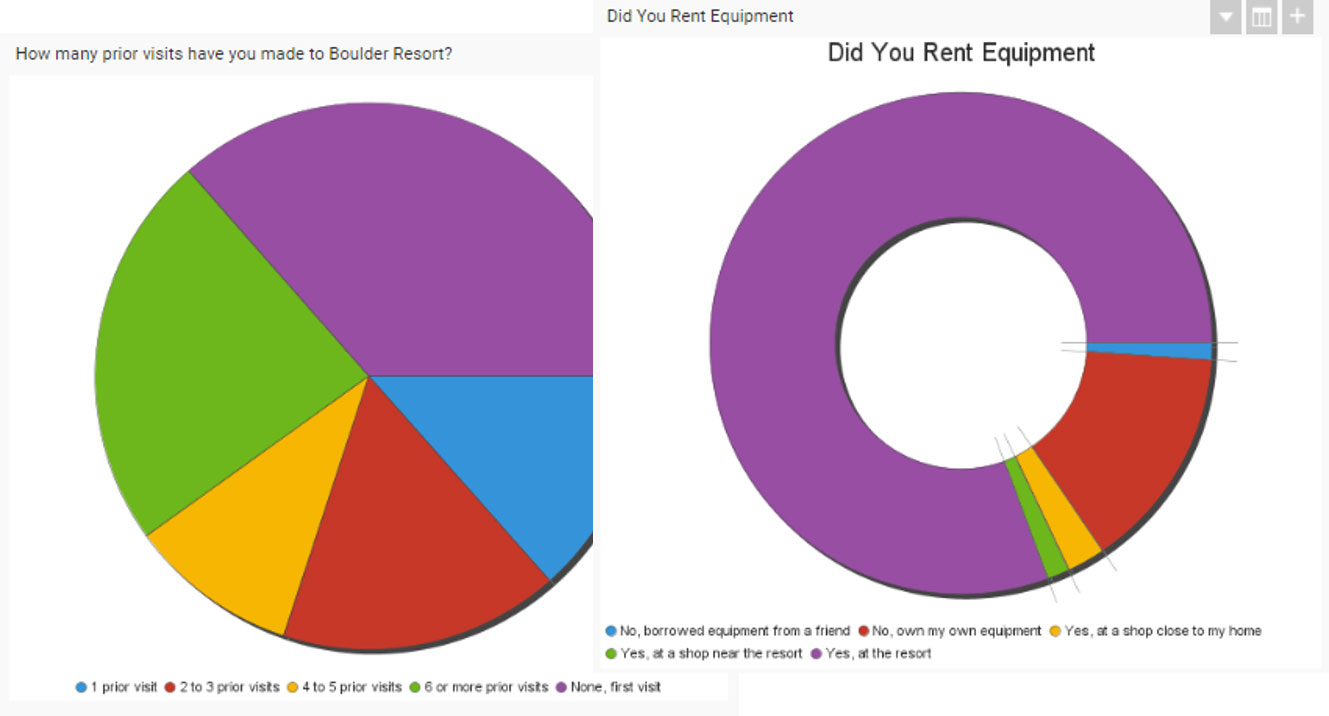
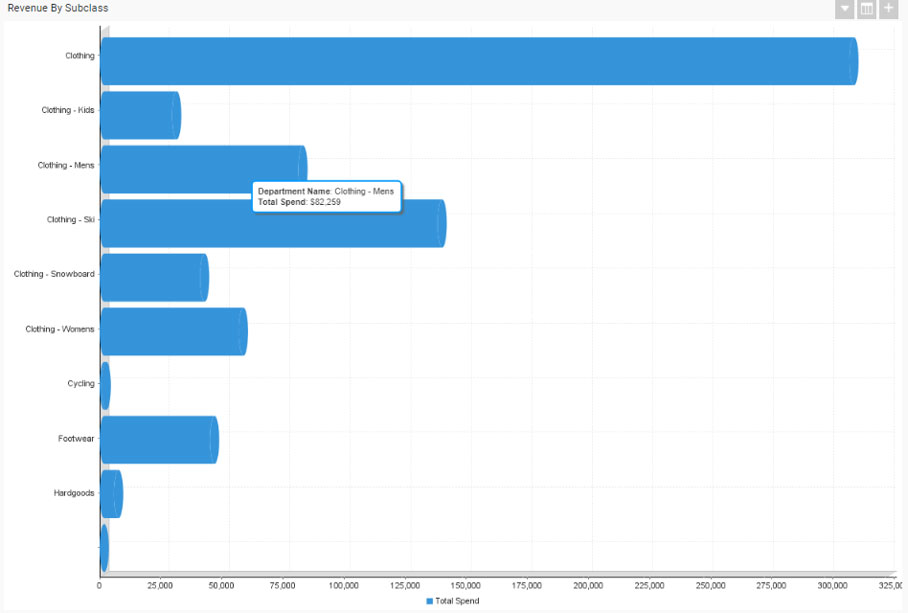
We have many ski resort and event companies that are able to dig deep in their data and see real-time reporting. Just to name a couple: NPS trends over time, Count of pass scans per day/time, Product-type by age range, Geography of total spend i.e. which regions are spending the most, Pass usage resort, Survey reporting, Top 30 individuals by transactions per month, and more!
CLIENT EXAMPLE:
Ski resort, Steven's Pass created a custom dashboard to real-time track:
- With a customized summary dashboard, Steven’s Pass is able to see a high level view of their survey results
- Surveys broken out individually for reporting
- Surveys broadcasted to the members in the business that need to see results for their department
- Broadcasts send weekly and have up-to-date data at all times
EXAMPLE DASHBOARDS